The heuristic value of a visit to the optician
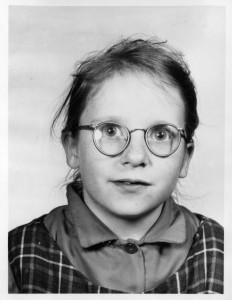
As a child in the 1960s, I had to undergo regular visits to the optician. I didn’t mind so much having to go. It was a chance to skip school, sit in Dipple and Conway’s snug little waiting room and read Rupert the Bear annuals. In thinking about the approach to reading and interpreting the data in my doctoral research, I was reminded of those visits. Just like in the eye examination, my visual acuity was being tested – how could I clearly see the data?
Using the concept of the lens, I created a coding framework based on the inductive process I had thus far conducted via the literature review and an initial thematic data analysis. The framework in fact comprised a series of eight lenses through which I read the data. Whilst it was not my intention to be overly prescriptive or sociologically reductive, using the framework as a reading tool enabled me to think at a deeper, more heuristic level, about what I was seeing in the context of the research questions.
I read the data (all 169,000 words) manually, through each lens in turn, using five different refractions, which allowed me to consider the specific research questions from different angles. Using the coding framework as a heuristic tool, informed by both an inductive and deductive process, enabled me to be more systematic. It also enabled me to remain connected to the theory. This is where the theory and data, never far apart, began to move closer together for the final analysis. The discipline of employing the refractions reminded me of having to wear the plastic blue NHS spectacles as child with a fabric plaster stuck over one of the lenses for whole weeks at a time, just to get my lazy eye to work that much harder – now that, I did mind!
Perhaps I should explain why I conducted a manual, in vivo analysis instead of using computer software. I attended a training course quite early on in the research, on the NVivo programme and immediately became concerned about the possibility of the data becoming subservient in some way to the software. It all seemed to be very process-driven – although I do acknowledge the plea, what is data analysis, if not a process? However, I was also concerned about the possibility of becoming distanced from the data, and losing the voice of the participants in a noise of nodes. I didn’t want to become detached from meaning and context. This is why I decided, therefore, to continue with a manual analysis. Sometimes a practical, hands on approach, can be the most productive, even if it does take a little longer… OK, a lot longer!
Through the coding and analysis, I attempted to make possible biases less opaque and to problematise structuring influences, which included my own inside experience and relationship with both the research topic and the research participants. I was once again reminded of those visits to the optician; this time in the consulting room, sitting in a high leather chair with my legs dangling, wearing heavy metal frames into which the nice optician slotted different lenses as I attempted to read the letters off the Snellen chart hanging on the wall at the far end of the room. The danger, as always, was the temptation to recall the sequence of letters from previous visits. I had to concentrate really hard on seeing it all as though I had never seen it before and yet still be able to recognise what I was looking at. As with re-reading the research data through the final, fine-grained analysis, I needed to see it all afresh and not make assumptions or rush to conclusions.
In applying this heuristic approach, I’m ultimately blending my existing practical knowledge of the research topic as an insider researcher, and my newly formed scholarly knowledge gained by doing the research itself. This is where I’m at right now, as I draw the picture into sharp focus and approach the task of writing the final chapter of my thesis.
Wish me luck!
